Learned Error Diagnosis Improves GEPA's Reflection
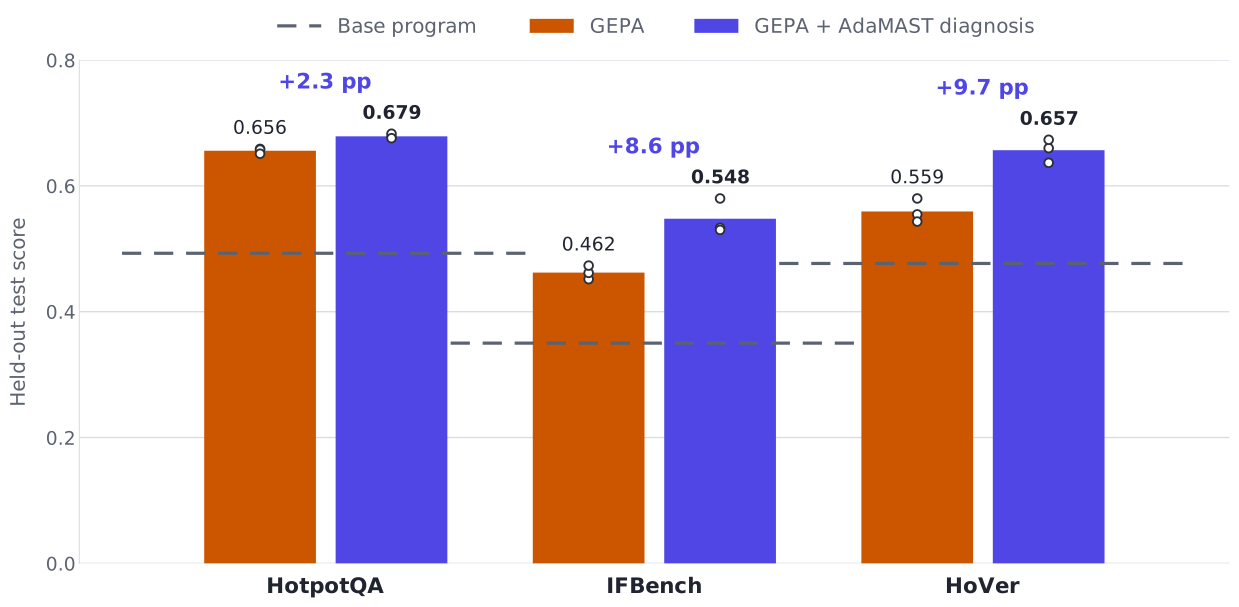
During each GEPA optimization round, a candidate is selected and evaluated on a minibatch of tasks. The reflection model then uses the resulting traces and the evaluator's feedback to revise the candidate's prompts. The standard evaluator feedback describes how the output performed: the correct answer, the evidence that was missed, the constraint that was violated. AdaMAST1 (code) introduced a second kind of feedback: a diagnosis of how the candidate failed, first used in the AdaMAST paper to guide mutation in evolutionary agent search built on AdaEvolve2. Here we bring that feedback to GEPA's reflection model. To find and categorize failures, AdaMAST learns a failure taxonomy3 automatically from the program's own traces. The diagnosis reaches the reflection model as concrete findings, each labeled with a failure mode: an entry in the taxonomy that names and defines one way the program fails. Because every execution's failures are categorized into the same failure modes, recurring problems across tasks group into patterns. The reflection model can then target the behavior behind each pattern rather than address each failure separately. Adding these diagnoses alongside the standard evaluator feedback improves GEPA's held-out scores on HotpotQA, IFBench, and HoVer by up to 9.7 percentage points over standard GEPA, under the same $60 online optimization budget (Figure 1).
During optimization, an LLM judge checks each of the candidate's execution trajectories against the taxonomy and reports each problem it detects as a finding: the failure mode, the step where it occurred, and the supporting evidence. The judge sees the task and the trajectory, but never the score, the gold answer, or the evaluator's feedback, so it diagnoses the process without being told whether the task succeeded. We run it as a separate call, instead of passing the taxonomy to the reflection model, because the reflection model already sees the evaluator's feedback.
How it works
Our approach consists of two stages: constructing a failure taxonomy tailored to the program, and using an LLM judge to apply that taxonomy during optimization to each candidate and provide the findings to the reflection model.
Taxonomy generation
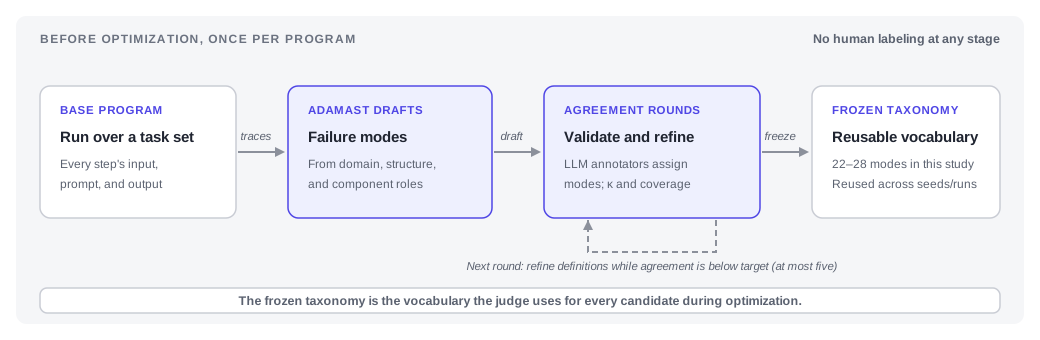
Before optimization, we run the base program on a set of tasks and give the resulting trajectories to AdaMAST (Figure 2). AdaMAST first analyzes the trajectories to understand the program's domain, its structure, and the role of each component. A separate pass then uses this analysis to generate failure modes. The result is a taxonomy of failure modes, each with a name, a definition, and guidance on when it applies and when it does not.
Validating and refining the taxonomy. The taxonomy then goes through several inter-annotator rounds. In each round, multiple LLM annotators independently apply the taxonomy to the same set of trajectories. AdaMAST measures their agreement and error coverage, and a refinement call clarifies the definition of any failure mode they disagreed on. Once the full process ends, the taxonomy is frozen and reused throughout optimization and in later runs of the same program. Our three taxonomies took four or five rounds each and have 22 to 28 failure modes. The appendix gives the full generation pipeline, including the annotation protocol and the stopping thresholds.
Judging during optimization
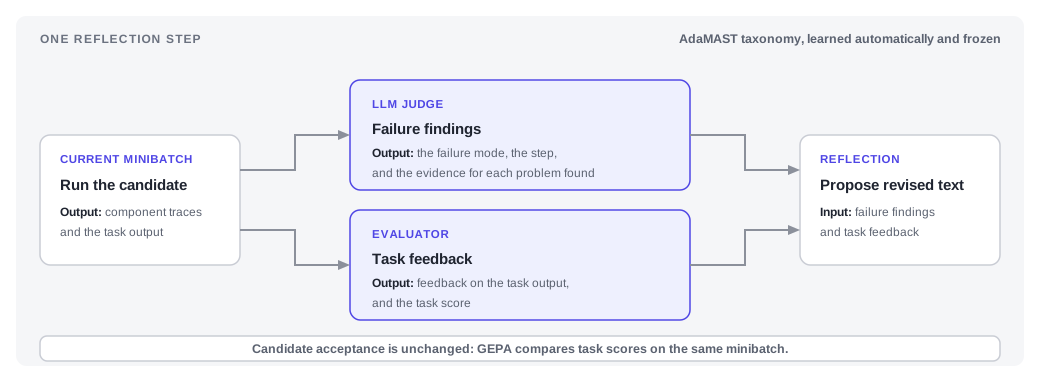
GEPA captures the candidate's execution traces for the minibatch used in reflection. The evaluator and the LLM judge analyze those executions independently: the evaluator assesses task performance, while a separate judge call reviews the traces against the frozen AdaMAST taxonomy (Figure 3). The judge examines successful and failed executions alike. A candidate can make a mistake midway and still reach the correct answer through a later recovery or a fortunate guess; the judge can report that mistake regardless of the outcome.
For each execution, the judge records the following: the failure modes identified, the steps where they occurred, and their supporting evidence. One execution can show several failure modes, and the same failure mode more than once.
In a multi-step program, GEPA revises one step per round; in a single-step program, it revises the whole prompt. We match that by passing the reflection model only the judge's findings for the step under revision. The evaluator's score still decides which candidates survive; the findings only inform reflection.
Results
AdaMAST error diagnosis improves GEPA's mean held-out score by up to 9.7 percentage points. We evaluated on three benchmarks: multi-hop question answering (HotpotQA), instruction following (IFBench), and multi-hop claim verification (HoVer). Each arm ran three seeds.
Setup
- Models. Haiku 4.5 as the task model; Sonnet 4.6 for both GEPA's reflection model and the judge.
- Splits. 150 train / 300 validation / 300 test on all three. HotpotQA is drawn from the fullwiki validation set (7,405 labeled examples), HoVer from the dev release (4,000 claims), stratified by hop count (2, 3, or 4).
- IFBench generalization. Train and validation come from
allenai/IF_multi_constraints_upto5; the test set is all 300 examples ofallenai/IFBench_test. The constraint vocabularies are disjoint, with 54 constraint IDs on the train side and 58 on the test side, so the result cannot come from replaying a train-side constraint ID. - Programs. HotpotQA and HoVer are four-step programs; IFBench is two steps, a generator and a checker.
- Feedback. Deliberately strong for the baseline: on training examples it names the correct answer (HotpotQA), the missing gold documents and the hop that lost them (HoVer), and each constraint's pass or fail (IFBench).
- Metrics. HotpotQA is scored by mean F1, IFBench by prompt-level loose accuracy, HoVer by strict all-document retrieval.
- Seeds. Three per arm, paired across arms.
| Benchmark | Base program | GEPA | GEPA + AdaMAST error diagnosis | Δ |
|---|---|---|---|---|
| HotpotQA (mean F1) | 0.4929 | 0.6559 (0.6511–0.6588) | 0.6788 (0.6758–0.6829) | +2.3 pp |
| IFBench (prompt-level loose) | 0.3500 | 0.4622 (0.4517–0.4733) | 0.5478 (0.5300–0.5800) | +8.6 pp |
| HoVer (strict all-document) | 0.4767 | 0.5593 (0.5433–0.5800) | 0.6567 (0.6367–0.6733) | +9.7 pp |
All nine seed-paired comparisons favor the AdaMAST arm. The appendix gives the per-seed results and the failure mode distributions.
What reflection did with the findings
In one HotpotQA run, both arms selected the same parent candidate and chose to rewrite the same step, summarize1, which still carried its default instruction, "Given the fields question, passages, produce the fields summary." Both reflection calls saw the same inputs, outputs, and evaluator feedback. The reflection call in the AdaMAST run additionally saw the judge's output: two findings, Spurious_Fact_Introduced_At_Summarization and Dual_Summary_Aggregation_Failure, with the evidence for each. The first quoted a sentence the summary had added, "Kapolei is colloquially known as being part of the leeward coast of Oahu", which the judge flagged as unsupported by the retrieved passages.
With feedback alone, the reflection model concluded that the summarizer was too cautious and rewrote toward confidence:
Directly answer the question... Do not hedge or say the answer cannot be
determined if you can reasonably infer it from context or general knowledge
combined with the passages.
With the findings, it concluded that the summarizer was inventing content and rewrote toward grounding:
Ground every claim strictly in the provided passages: Do NOT introduce any
facts, inferences, or details that are not explicitly stated in the passages.
...
Do not add colloquial nicknames, historical context, or additional facts
unless they are directly quoted or stated in one of the provided passages.
The second rewrite tracks the evidence: the judge had quoted a colloquial nickname, and the new instruction forbids exactly that. Spurious_Fact_Introduced_At_Summarization was also the most frequently reported failure mode on HotpotQA, accounting for 20.3% of findings.
Cost breakdown
Standard GEPA and GEPA with AdaMAST each had $60 per seed for online optimization. Because the latter paid for its judge calls from that same budget, it proposed fewer candidates, 43 per run on average against 55 for standard GEPA. A larger share of its proposals passed GEPA's acceptance check, 50.8% against 45.1%, leaving it with about 22 accepted candidates per run against 25 for standard GEPA.
AdaMAST adds a one-time cost outside that budget for taxonomy generation: $1.14 to $1.87 to collect traces from the base program and $3 to $4 to generate the taxonomy, or $4 to $6 per benchmark in total. Taxonomy generation only has to run once per program, since the frozen taxonomy is reused across every run of that program, such as the three seeds per benchmark here. The appendix gives the full accounting and candidate counts.
Integration point
Using the enricher
The failure_taxonomy module and preparation pipeline are available in the companion repository.
Pass the judge's findings to GEPA through the optional reflective_dataset_enricher argument:
import gepa

from failure_taxonomy import LLMFailureJudge, TaxonomyFeedbackEnricher, load_taxonomy

taxonomy = load_taxonomy("taxonomy.json")  # produced by the preparation pipeline, or your own
enricher = TaxonomyFeedbackEnricher(judge=LLMFailureJudge(taxonomy=taxonomy, lm=reflection_lm))

result = gepa.optimize(
    seed_candidate=seed,
    adapter=my_adapter,  # DSPy, LangChain, or custom, unchanged
    trainset=trainset,
    valset=valset,
    reflection_lm=reflection_lm,
    max_metric_calls=2000,  # or any other GEPA stop condition
    reflective_dataset_enricher=enricher,
)
With optimize_anything, the same enricher goes on the reflection config:
from gepa.optimize_anything import EngineConfig, GEPAConfig, ReflectionConfig, optimize_anything

result = optimize_anything(
    seed_candidate=seed,
    evaluator=my_evaluator,  # its side_info records per-step calls under "module_calls"
    dataset=trainset,
    valset=valset,
    config=GEPAConfig(
        engine=EngineConfig(max_metric_calls=2000),  # or any other GEPA stop condition
        reflection=ReflectionConfig(reflective_dataset_enricher=enricher),
    ),
)
For step attribution, record each step's name, input, prompt, and output under module_calls in the trajectory. In optimize_anything, these calls belong in the evaluator's side_info; the judge reads them without the evaluation results.
Next steps
We want to test whether the judge can supply both reflective feedback and the scores used to rank and accept candidates, allowing optimization without gold labels or a task-specific evaluator.
Appendix
How AdaMAST builds the taxonomy
Drafting. The draft runs as eight stages over the harvested traces. Three read the traces first: one derives the system's domain and task type, one extracts the trace format and the agents and architecture it implies, and one sweeps every trace for behavioral signals such as errors, refusals, repetition, and abrupt endings. Three generation stages then write the failure modes, one per category. The last two deduplicate failure modes across categories, check them against each other, and test every failure mode against the taxonomy's structural rules, repairing what fails.
The categories keep failure modes from collapsing into one another:
- A, system failures: what broke in the execution itself, independent of whose job it was. Output that never arrived or arrived unusable, context that was lost, a handoff that dropped information, looping, refusal, timeouts, and tool errors all land here. They are drafted from the system's topology and handoffs and from behavioral signals found in the traces, and each one names a cause rather than the symptom it leaves behind.
- B, role failures: how a component's own job went wrong, judged on the quality of its work. The boundary against A is strict: a B failure mode applies only when the component ran and produced usable output whose quality was wrong, such as missing what mattered, working superficially, or choosing the wrong method. Anything that produced no usable output at all is an A failure mode, not a B one. B failure modes are drafted per role, from what each role is there to do.
- C, reasoning failures: why the logic went wrong. A C failure mode names the flaw itself and never the component that committed it, so one flaw stays one failure mode wherever in the program it shows up. Two passes draft them, one from the error patterns known to the domain and one from flaws found in the traces themselves.
Agreement rounds. Each round puts five traces in front of four annotators, four separate contexts of one model that start identical and diverge only through what they are shown. A round runs five phases:
- Independent discovery. Each annotator lists the errors it sees, alone.
- Reconciliation. Annotators see what the others found and deliberate. An error needs two annotators to raise it before it is discussed, and three to be confirmed.
- Failure typing. Confirmed errors are sorted into A, B, or C before any failure mode is chosen.
- Failure-mode assignment. Each annotator assigns failure modes independently, validated against the category rules.
- Deliberation. Disagreements go to a discussion of at most two exchanges.
Agreement is measured on the independent assignments, as macro Fleiss' κ over the failure modes actually used, alongside coverage, the share of confirmed errors that received at least one failure mode. The targets are κ at or above 0.75 and coverage at or above 0.70, within a cap of five rounds.
Between rounds, while agreement is below target, a refinement call rewrites the definitions of the failure modes with the lowest agreement, adds guidance on when each one applies and when it does not, and attaches the decision rules the annotators converged on.
Freezing. The companion pipeline now trims the taxonomy to the failure modes the base program's traces support before freezing it. That step was added after the study, so the taxonomies behind these results were frozen untrimmed.
Table A1 reports the agreement rounds for each benchmark's taxonomy.
| Benchmark | Agreement rounds | First-round κ | Final κ | Final coverage | Final failure modes |
|---|---|---|---|---|---|
| HotpotQA | 4 | 0.707 | 1.0 | 1.0 | 28 |
| IFBench | 5 | 0.689 | 1.0 | 1.0 | 24 |
| HoVer | 4 | 0.925 | 1.0 | 1.0 | 22 |
These values measure annotator agreement and coverage on the sampled traces; they do not establish the judge's reliability on held-out data.
Per-seed results
Every row is a paired comparison with the same seed and optimization budget. The second arm adds the judge and feeds its findings to the reflection model.
| Benchmark | Seed | GEPA | GEPA + AdaMAST error diagnosis | Δ |
|---|---|---|---|---|
| HotpotQA | 1 | 0.6588 | 0.6776 | +1.9 pp |
| HotpotQA | 2 | 0.6577 | 0.6829 | +2.5 pp |
| HotpotQA | 3 | 0.6511 | 0.6758 | +2.5 pp |
| IFBench | 1 | 0.4517 | 0.5800 | +12.8 pp |
| IFBench | 2 | 0.4617 | 0.5333 | +7.2 pp |
| IFBench | 3 | 0.4733 | 0.5300 | +5.7 pp |
| HoVer | 1 | 0.5547 | 0.6367 | +8.2 pp |
| HoVer | 2 | 0.5800 | 0.6600 | +8.0 pp |
| HoVer | 3 | 0.5433 | 0.6733 | +13.0 pp |
Budget accounting and candidate counts
The $60 per seed covers the online loop only: minibatch rollouts, reflection, validation of promoted candidates, and, in the AdaMAST arm, the judge, which uses the same model as reflection. The base program's initial validation and the final test evaluation sit outside it, for both arms. Candidate selection, sampling, scheduling, and the rule for accepting a proposal are identical in both arms.
| Benchmark | GEPA proposals / accepted | AdaMAST proposals / accepted | Trace harvest |
|---|---|---|---|
| HotpotQA | 52.0 / 30.3 | 42.0 / 26.7 | $1.14 |
| IFBench | 49.0 / 23.7 | 46.0 / 21.7 | $1.87 |
| HoVer | 65.3 / 21.0 | 41.3 / 17.3 | $1.28 |
Part of the AdaMAST arm's budget goes to the judge, which is why it proposes fewer candidates.
Trace harvesting runs the base program once over a chosen trace source, the validation split in our runs, and records the inputs and outputs of every step. Taxonomy generation and refinement cost another $3 to $4 per benchmark, so one-time preparation comes to $4 to $6, roughly 3% of the $180 spent across three AdaMAST seeds.
Failure mode distributions
Totals per benchmark, then the counts for the most frequent modes. Shares are of all occurrences on that benchmark, and the final row of each table collapses the remaining failure modes.
| Benchmark | Judged traces | Failure modes used | Most frequent |
|---|---|---|---|
| HotpotQA | 2,356 | 22 | Spurious_Fact_Introduced_At_Summarization (20.3%) |
| IFBench | 989 | 22 | Checker_Missed_Constraint_Violation_In_Draft (19.0%) |
| HoVer | 934 | 21 | Partial_Verification_Treated_As_Full (18.8%) |
HotpotQA: 1,990 occurrences over 2,356 traces, 22 of 28 failure modes used.
| Failure mode | n | Share |
|---|---|---|
Spurious_Fact_Introduced_At_Summarization |
403 | 20.3% |
Retrieval_Returns_Topically_Adjacent_But_Irrelevant |
373 | 18.7% |
Instruction_Non_Compliance_In_Output_Format |
266 | 13.4% |
Unconditional_Termination_Masking_Low_Quality_Output |
204 | 10.3% |
Solver_Answer_Not_Grounded_In_Evidence |
137 | 6.9% |
Dual_Summary_Aggregation_Failure |
135 | 6.8% |
Solver_Unwarranted_Uncertainty_When_Answer_Available |
129 | 6.5% |
Solver_Incorrect_Factual_Answer |
98 | 4.9% |
| 14 further failure modes | 245 | 12.3% |
IFBench: 2,739 occurrences over 989 traces, 22 failure modes used.
| Failure mode | n | Share |
|---|---|---|
Checker_Missed_Constraint_Violation_In_Draft |
520 | 19.0% |
Spurious_Content_Addition |
311 | 11.4% |
Solver_Constraint_Noncompliance_In_Draft |
290 | 10.6% |
Keyword_Or_Element_Count_Error |
233 | 8.5% |
Structural_Format_Constraint_Violation |
233 | 8.5% |
Agent_Task_Refusal_Or_Abandonment |
164 | 6.0% |
Instruction_Non_Compliance |
145 | 5.3% |
Forbidden_Content_Inclusion |
144 | 5.3% |
| 14 further failure modes | 699 | 25.5% |
HoVer: 2,119 occurrences over 934 traces, 21 failure modes used.
| Failure mode | n | Share |
|---|---|---|
Partial_Verification_Treated_As_Full |
398 | 18.8% |
Instruction_Non_Compliance |
371 | 17.5% |
Coordinator_Misidentifies_Critical_Unverified_Sub_Claim |
270 | 12.7% |
Absence_Of_Evidence_Treated_As_Evidence_Of_Absence |
255 | 12.0% |
Contradictory_Sub_Summaries_Not_Reconciled |
107 | 5.0% |
Contradictory_Evidence_Ignored_In_Verdict |
107 | 5.0% |
Hallucinated_Passage_Support |
102 | 4.8% |
Coordinator_False_Claim_Verification_Acceptance |
75 | 3.5% |
| 13 further failure modes | 434 | 20.5% |
-
Mert Cemri, Andrei Cojocaru, Melissa Pan, Shu Liu, Shubham Agarwal, Alexander Krentsel, Jay Tang, Kannan Ramchandran, Joseph E. Gonzalez, Matei Zaharia, Alexandros G. Dimakis, and Ion Stoica, "Fantastic Adaptive Taxonomies and How to Use Them," ICML 2026 FAGEN Workshop (Best Paper). Project page. Code. ↩
-
Mert Cemri, Shubham Agarwal, Akshat Gupta, Shu Liu, Audrey Cheng, Qiuyang Mang, Ashwin Naren, Lutfi Eren Erdogan, Koushik Sen, Matei Zaharia, Alexandros G. Dimakis, and Ion Stoica, "AdaEvolve: Adaptive LLM-Driven Zeroth-Order Optimization," 2026. Blog post. ↩
-
Mert Cemri, Melissa Z. Pan, Shuyi Yang, Lakshya A. Agrawal, Bhavya Chopra, Rishabh Tiwari, Kurt Keutzer, Aditya Parameswaran, Dan Klein, Kannan Ramchandran, Matei Zaharia, Joseph E. Gonzalez, and Ion Stoica, "Why Do Multi-Agent LLM Systems Fail?," 2025. ↩